Diagnostics
The Diagnostics window can be used to investigate any problems that you encounter, such as hardware and scripting errors or performance issues. It contains 5 tabs: View, Tracking, Log, Lua State, and Support.
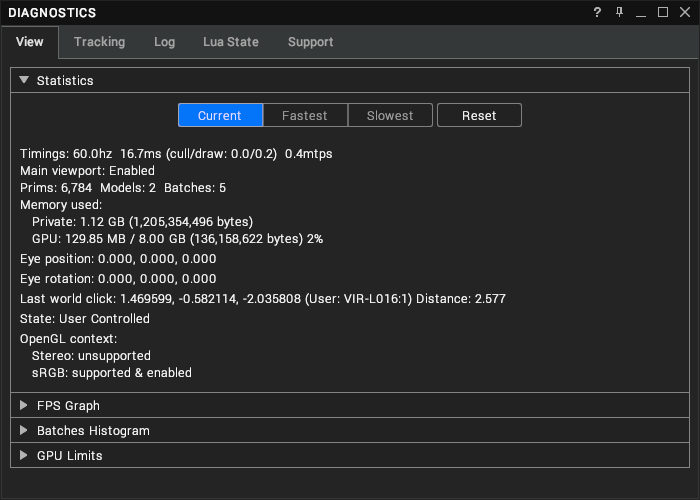
To open the Diagnostics window, click on the Virtalis button at the top-left of the Toolbar and select Windows > Diagnostics. Alternatively, click and hold left mouse button over the Windows menu of the Toolbar and select Diagnostics. It can also be shown or hidden with Ctrl + D.
View
The View tab displays information about the 3D view such as the framerate and current camera position.
Statistics
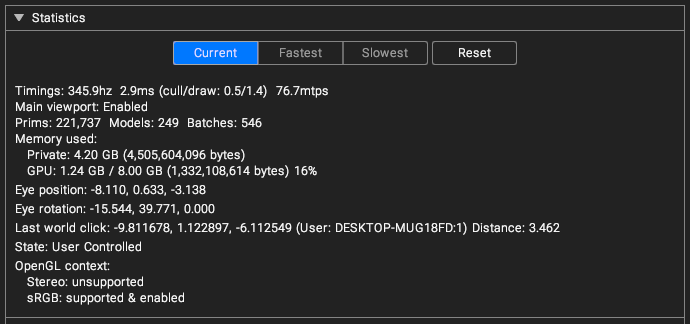
Buttons
| Button | Description |
|---|---|
| Current | Show the current frame statistics (timings and memory used). |
| Fastest | Show the fastest frame statistics (timings and memory used). |
| Slowest | Show the slowest frame statistics (timings and memory used). |
| Reset | Reset the fastest and slowest frame statistics. |
Text
| Statistic | Description |
|---|---|
| Timings | The current frame rate in Hertz, the time to render the last frame in milliseconds (with time in milliseconds spent in the cull and draw phases), and how many millions of triangles are drawn per second. |
| Main viewport | Shows whether the main viewport is enabled or disabled. |
| Prims / Models / Batches | The number of primitives, models and batches being rendered in the current view. |
| Shadow map / Probe / Render-to-texture updates | The number of shadow map, probe and render-to-texture updates in the last frame. |
| Memory used |
|
| Eye position | The current position of the eyes in the world. |
| Eye rotation | The current rotation of the eyes in the world. |
| Last world click | The absolute world position of the last mouse click, the user who made that click, and the distance in metres from the camera to the click location. |
| State | The animation state and whether the user controls it. |
| OpenGL context |
|
FPS Graph

The FPS Graph shows the frames per second since the session of Visionary Render began. A new bar is added to the graph each second. Hover the mouse over a bar to see the FPS that it represents. The higher the bar, the higher the FPS.
Batches Histogram
The Batches Histogram is an advanced utility for diagnosing performance issues in your scenes. Visionary Render draws meshes by sending triangle draw commands - or "batches" - to the graphics card. This incurs a cost regardless of how many triangles are being drawn, but that cost can be reduced by sending less draw commands to draw the same number of triangles. You can achieve this by merging Meshes under a single GeoGroup and GeoGroups under a single Model or LOD. To do this, rearrange your assets in the original software that you used to author them, or in Visionary Render by tweaking importer settings or applying geometry operators.
By default, the histogram is hidden. To open it, click on the Batches Histogram rollout. It will be automatically generated for the current frame and displayed as above. The histogram is arranged into a series of bars - or "bins" - whose heights show the percentage of batches in the frame that render a specified range of triangles. A full height bar represents 100% of the batches in the frame, whilst half height is 50%, etc. Empty bins are not shown. Mouse over one of the bars to see a tooltip with the exact figures.
In the example above, we see that there are 29 batches in the frame that render between 1024 and 1087 triangles. 29 batches is 2.74% of the total number of batches in the frame. If the histogram shows that most of your batches draw between 0 and 63 triangles (i.e. the bar at the far left is the highest) then you're not using the graphics card efficiently and your Meshes and/or GeoGroups should be merged.
Bin Size
By default, the bars are arranged from left to right in increments of 64 triangles. You can modify Bin Size to change the range of triangles represented by each bar in the histogram.
GPU Limits

The GPU Limits rollout shows various limitations of your graphics card such as maximum viewport size and maximum 2D/3D texture size.
If you exceed these limits in your scene then Visionary Render may become unresponsive.
Cluster
On a cluster, a drop-down menu will be shown in the toolbar to permit you to view the Statistics, Batches Histogram and GPU Limits for different cluster nodes.

Tracking
The Tracking tab shows input sensor data for any connected tracking hardware in the current desktop immersion mode as well as any AR markers.
![]()
Diagnostic Tools
The Mirror Mode button turns the screen into a virtual mirror, which permits you to check the alignment of the avatar and tracking helpers with the real-world tracked devices. Press to enable or disable it.
Statistics
This drop-down provides information that can be used to diagnose issues with tracking. If the inputs are not displayed here or are not updating, then tracking must be disabled, or no data is being received from the tracked device.
AR Markers
The Tracking tab of the Diagnostics window shows a table with all of the AR markers in your scene and/or detected by your headset. See Augmented Reality for more information about AR support in Visionary Render.
Log
The Log tab displays information, warnings, and errors. When you experience an issue in the software it is a good idea to check the log first for any errors.
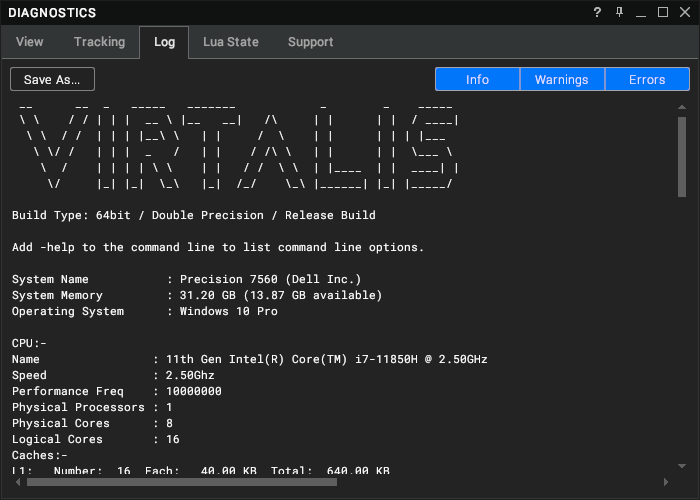
If necessary, additional debug messages can be enabled with the Verbose Log setting under User Interface > Advanced.
Header
The start of the log contains a header with information about the application and your hardware (CPU, GPU, network adapters, etc.). This is generated when the application is started.
Key
| Text Colour | Type | Description |
|---|---|---|
| White | Information | Examples include the log header and networking information. |
| Yellow | Warning | Typically problems that were resolved by Visionary Render or that don’t prevent something important from working or loading. These contain the prefix “[W]”. |
| Red | Error | Typically problems that couldn’t be resolved by Visionary Render and that prevent something important from working or loading. These contain the prefix “[E]”. See Errors for solutions to common application errors. |
Here's an example of the different kinds of text:

Usage
Copy
To copy text from the log, hold down left mouse button and drag to select the text that you wish to copy, then right-click and select Copy from the context menu. The text will be copied to the clipboard.

Clear
To clear all the existing text in the log, right-click in the text area and select Clear from the context menu.
Save
To save the log to a file, click on the Save As... button at the top-left of the text area. A file browser will appear so that you can select a name and location for the log file.
Filters
To filter the log, click on one of the filter buttons at the top-right of the text area.
| Button | Description |
|---|---|
| Debug | Show or hide debug information. This button is shown when the Verbose Log setting under User Interface > Advanced is enabled. |
| Info | Show or hide information (white text). |
| Warnings | Show or hide warnings (yellow text). |
| Errors | Show or hide errors (red text). |
Lua
The log also displays messages related to Lua scripting, such as information and errors. These contain the prefix {Lua}. If an error occurs in a script, a hyperlink will be added to the log - click on it to open the script in the Script Editor.

Cluster
On a cluster, a drop-down menu will be shown in the toolbar to permit you to view and save the logs of different cluster nodes. A Save All... button is added to permit all the cluster node logs to be saved to a directory.

Lua State
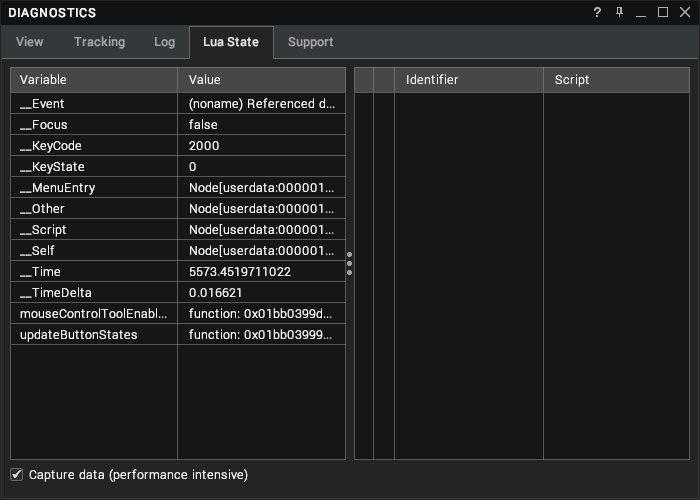
The Lua State tab is an advanced feature for diagnosing issues in Lua scripts. The left panel shows the current values of built-in and user global variables. The right panel shows the scripts that are currently running.
Capture Data
Click on the Capture data checkbox to populate the window.
This is performance intensive so don’t forget to disable it again when you’re done.
Terminating a Script
If you have a troublesome script that you wish to terminate, click on the "X" button to the left of it to do so.
See the Visionary Render Programming Guide for more information.
Support
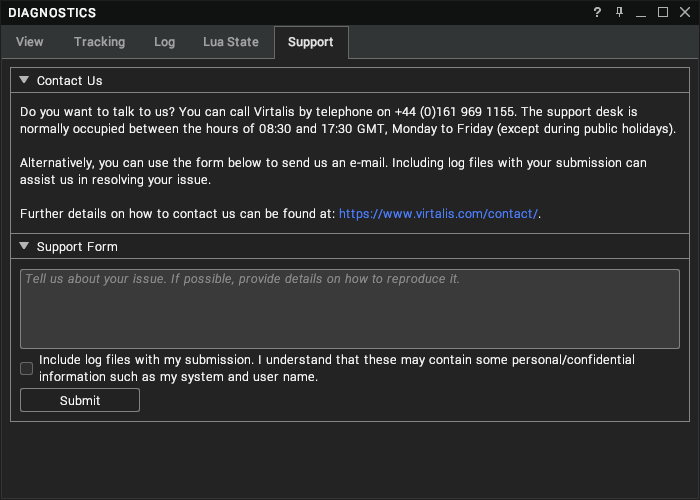
The Support tab provides information on how to contact us if you encounter a problem. It also permits a support e-mail to be generated with an optional log file attached to it.
Support Form
This section enables you to generate an e-mail ready to be sent to our support team.
First, please describe your issue in the text box and provide any reproduction steps, then click on the checkbox if you are willing to send us a log file (it will help us to debug your issue).
When done, press the Submit button. A new e-mail will be created in your default e-mail client and you can send the message when ready.